
Frontier Airlines Q3 2026 Earnings: Fares Rise 71% as Fuel Costs Surge

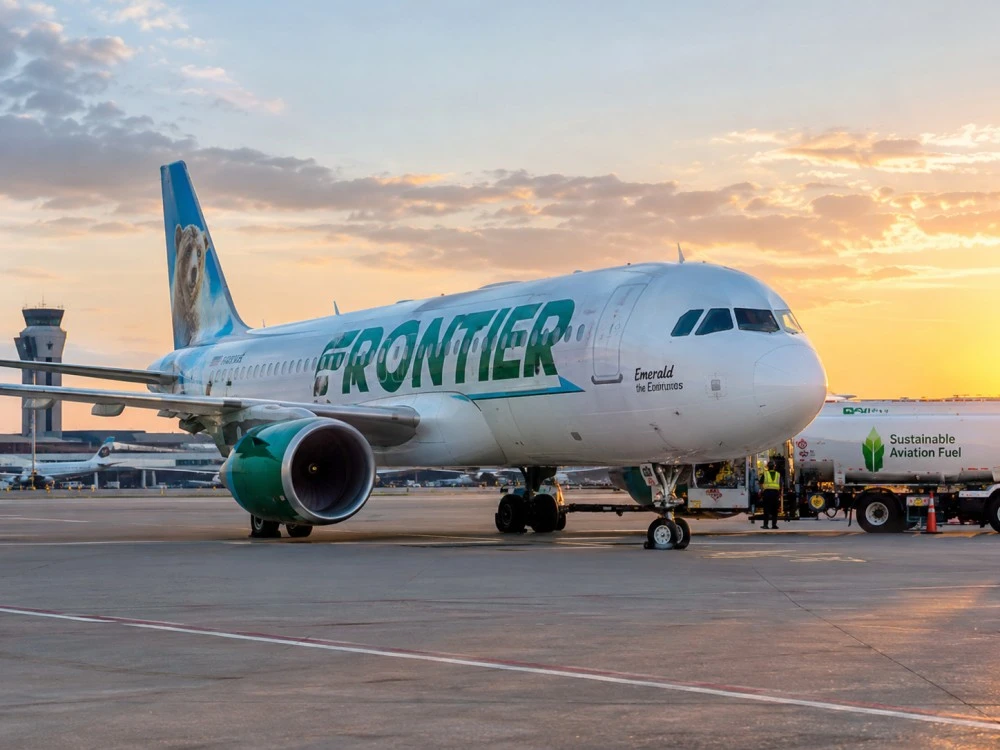
Frontier Airlines delivered record third-quarter 2026 revenue of $1.355 billion, up 53% year over year, as average fare revenue per passenger climbed 71% and fuel expense surged 82%. Yet the airline still reported a $104 million GAAP net loss, exposing the difference between stronger revenue performance and sustainable profitability. For executives and investors, Frontier’s results offer a practical test of pricing power, cost control and the financial resilience of a high-fixed-cost business. ir.flyfrontier.com
Boardroom Briefing (Key Takeaways)
- Frontier Airlines generated $1.355 billion in third-quarter revenue, a company record, as passenger demand and revenue-management initiatives supported stronger commercial performance.
- Average fare revenue per passenger increased 71% to $67.82, while total revenue per passenger, including ancillary revenue, rose 30% to $138.22.
- Fuel expense climbed 82% to $425 million, while the average fuel price rose 56% to $3.96 per gallon.
- Profitability remained divided: Frontier reported a $104 million GAAP net loss but $40 million in adjusted net income, reflecting significant adjustments to reported expenses.
- Unit economics improved on the revenue side, with revenue per available seat mile (RASM) rising 30% to 11.87 cents, while adjusted cost per available seat mile (CASM) increased 16% to 11.56 cents.
- Fourth-quarter guidance points to continued uncertainty, with adjusted diluted earnings per share forecast between a $0.15 loss and a $0.05 profit.
Source: Frontier Group Holdings’ third-quarter 2026 earnings release. ir.flyfrontier.com
Frontier’s Record Revenue Reveals a New Equation for Airline Pricing Power
Frontier’s third-quarter results show that stronger fares and passenger demand can lift revenue faster than capacity, but they do not guarantee sustainable profits.
The airline generated $1.355 billion in revenue, compared with $886 million in the same quarter of 2025. Passenger volume increased 18% to approximately 9.8 million, while available seat miles—the measure of seats offered multiplied by miles flown—also rose 18%. Revenue per available seat mile increased 30% to 11.87 cents. ir.flyfrontier.com
The fare increase is particularly striking. Average fare revenue per passenger reached $67.82, compared with $39.74 a year earlier. But this does not mean every Frontier ticket became 71% more expensive. The average can change because of route mix, booking timing, fare classes and passenger composition, as well as pricing decisions.
Ancillary revenue also matters. Non-fare passenger revenue per passenger increased 7% to $67.47, lifting total revenue per passenger to $138.22, up 30%.
Frontier CEO Jimmy Dempsey attributed the record revenue to strong travel demand and continued progress in revenue-management initiatives. The company also said it maintained cost discipline despite higher-than-expected fuel prices. ir.flyfrontier.com
The executive lesson is straightforward: pricing power is best measured through realized revenue per unit of capacity, not through a headline fare increase alone. Leaders should assess price, volume, product mix and cost together.
Why an 82% Fuel-Cost Surge Can Outrun Revenue Growth
Frontier’s fuel expense increased to $425 million in Q3 2026, substantially outpacing its 53% revenue growth and placing pressure on the economics of its commercial gains. ir.flyfrontier.com
The average fuel cost rose from $2.54 to $3.96 per gallon, a 56% increase. Fuel consumption also increased 16%, partly reflecting the airline’s expanded flying activity. The combination of higher prices and greater consumption explains why total fuel expense grew faster than revenue.
But fuel is not the entire cost equation.
Frontier reported total operating expenses of $1.463 billion, compared with $963 million a year earlier. Aircraft rent increased 66% to $301 million, while salaries, wages and benefits rose 10% to $275 million. The reported figures also included substantial aircraft lease-return-related charges and other adjustments, making the distinction between reported and adjusted expenses essential. ir.flyfrontier.com
The relevant management question is whether incremental revenue covers incremental operating costs.
Consider three indicators:
- Revenue per available seat mile (RASM): Revenue generated for each unit of available capacity.
- Cost per available seat mile (CASM): Operating costs per unit of available capacity.
- Incremental contribution margin: The additional revenue remaining after the variable costs associated with generating it.
Frontier’s reported RASM of 11.87 cents exceeded adjusted CASM of 11.56 cents, a difference of 0.31 cents per available seat mile. That spread is a useful operating indicator, but it is not net profit: the measures use adjusted expense definitions, and financing, taxes and other items still matter. ir.flyfrontier.com
The lesson for CFOs: higher sales can improve operating economics even when total costs rise sharply, but the quality of that improvement depends on unit margins and the complete income statement.
The Executive Framework for Measuring Genuine Pricing Power
Executives should measure pricing power by connecting realized revenue to demand, operating costs and cash generation.
Separate fare growth from volume and ancillary revenue
Frontier’s fare revenue per passenger increased 71%, but passenger volume also grew 18%, and total ancillary revenue per passenger increased 6%. Those figures describe different commercial drivers and should not be treated as interchangeable. ir.flyfrontier.com
A CFO or commercial leader should build a revenue bridge separating:
- Fare changes and booking mix.
- Passenger volume and load factor.
- Ancillary revenue and other income.
- Capacity changes and route mix.
- The incremental costs required to serve additional passengers.
This helps determine whether revenue growth reflects stronger pricing, increased activity, or a combination of both.
Test the cost of every incremental dollar
The basic calculation is:
Incremental contribution = Incremental revenue − Incremental variable operating costs.
For an airline, the assessment should include fuel, passenger-related servicing, airport and handling charges, and other variable costs. Fixed and semi-fixed expenses, including aircraft lease commitments and staffing, should be assessed separately.
Frontier’s adjusted CASM excluding fuel, stage-length adjusted to 1,000 miles, increased 3% to 7.40 cents. That is a more informative signal of underlying cost pressure than the fuel bill alone, although the figure still reflects the company’s chosen adjustments. ir.flyfrontier.com
Executives in other industries can apply the same method. A manufacturer may raise selling prices while paying more for raw materials; a software company may grow subscriptions while increasing infrastructure spending. In each case, sales growth must be evaluated against the cost of delivering those sales.
Model base, stress and recovery scenarios
A practical forecast should test three cases:
- Base case: Expected demand, current pricing assumptions and management’s projected costs.
- Stress case: Higher input costs, weaker demand and lower realized revenue.
- Recovery case: Improving unit revenue, disciplined capacity growth and easing cost pressure.
Each scenario should include operating margin, liquidity, cash generation and break-even assumptions. For Frontier, the difference between its third-quarter average fuel cost and its fourth-quarter fuel-price assumption makes this sensitivity analysis especially relevant.
The Profitability Trap: Why Record Revenue Is Not the Same as Financial Strength
Record revenue does not establish a durable turnaround because reported earnings depend on the complete cost base, accounting adjustments and financing obligations.
Frontier reported a $104 million GAAP net loss for Q3 2026, compared with a $77 million loss in the prior-year quarter. It also reported $40 million in adjusted net income, or $0.18 per diluted share. The adjusted result excluded specified items that affected reported expenses. ir.flyfrontier.com
The difference deserves scrutiny rather than an automatic preference for either figure.
GAAP earnings follow established accounting rules. Adjusted earnings remove items defined by management under a non-GAAP methodology. Such adjustments can help readers evaluate underlying operations, but they should be reconciled to reported results and assessed for their economic significance.
Frontier’s release identified aircraft lease-return agreements and a collective bargaining contract ratification among its adjustments. These items help explain why adjusted operating expenses were below reported expenses. Their treatment does not eliminate the underlying need to manage aircraft commitments and labor costs. ir.flyfrontier.com
Investors should also distinguish accounting earnings from operating cash flow and free cash flow. An adjusted profit does not automatically mean a company generated positive free cash flow, just as a GAAP loss does not independently establish that its core commercial performance deteriorated.
Frontier ended the quarter with approximately $1.18 billion in total liquidity. That provides useful context, but liquidity alone cannot demonstrate that future operations will be profitable. ir.flyfrontier.com
The contrarian point: strong commercial execution and financial vulnerability can coexist. Revenue growth is encouraging; sustainable margins, cash generation and balance-sheet resilience determine whether that growth creates lasting value.
What Frontier’s Q3 Results Reveal About Capacity, Competition and Demand
Frontier’s results show that higher fares can coincide with expanding capacity, challenging the assumption that fare increases must result from a reduction in available seats.
Available seat miles rose 18%, while passenger volume also increased 18%. The airline’s flown load factor was 78.8%, down from 80.7% in the prior-year quarter. Revenue per available seat mile nevertheless rose 30%. ir.flyfrontier.com
That combination matters. Frontier generated more revenue per unit of capacity despite a lower load factor, suggesting that improved revenue realization played a significant role in its quarterly performance.
The figures do not, by themselves, establish why fares rose. Route mix, booking behavior, competitive capacity, demand conditions and revenue-management decisions can all influence results. Claims that a specific competitor’s exit caused the increase require independent supporting evidence.
The same principle applies beyond aviation. A business can expand output while improving average selling prices, but leaders must determine whether those gains reflect stronger demand, a favorable customer mix or a temporary shift in competitive conditions.
Executives should examine whether pricing improvements persist across routes, customer segments and booking periods. They should also watch whether higher prices begin to reduce demand or require additional promotional spending.
The strategic implication: market structure can create opportunities to raise prices, but the durability of those opportunities depends on customer behavior and the economics of serving demand.
Frontier’s Q4 Guidance Puts Fuel Assumptions and Execution Under the Microscope
Frontier’s fourth-quarter guidance suggests that the company expects continued operating uncertainty, even after a strong third quarter.
The company forecast adjusted diluted earnings per share between a $0.15 loss and a $0.05 profit. It assumed an average fuel cost of $4.75 per gallon and projected capacity growth of approximately 5%–6% year over year. ir.flyfrontier.com
The fuel assumption is particularly important because Frontier’s third-quarter average fuel cost was $3.96 per gallon. The guidance therefore anticipates a higher average fuel cost, although the ultimate result will depend on realized prices, consumption and operating performance.
Management also has to execute against revenue expectations while managing nonfuel costs. A forecast is a set of assumptions, not a guarantee that those assumptions will hold.
Investors and executives should monitor five indicators in subsequent reporting:
- RASM: Whether revenue per unit of available capacity continues to improve.
- CASM excluding fuel: Whether underlying operating costs remain controlled.
- Fuel cost per gallon: Whether realized fuel costs diverge from guidance.
- Load factor and passenger volume: Whether higher fares weaken demand.
- GAAP earnings, adjusted earnings and liquidity: Whether commercial gains translate into broader financial resilience.
These measures should be assessed together. No single metric can determine whether Frontier’s pricing strategy is sustainable.
The Strategic Playbook: Five Decisions Executives Should Make Now
Frontier’s results offer a practical framework for leaders operating in businesses exposed to volatile input costs and high fixed expenses.
1. Build a pricing bridge. Separate price realization from customer mix, sales volume, ancillary revenue and capacity changes. This prevents executives from attributing every increase in revenue to pricing power.
2. Stress-test variable costs. Model multiple input-cost and demand scenarios. For an airline, fuel is central; for a manufacturer, the equivalent may be metals, electricity or freight.
3. Protect contribution margin. Measure the additional costs associated with every incremental sale. Revenue growth should support profitable expansion, not simply increase operational complexity.
4. Align capacity with demand. Expansion should be evaluated against expected returns, utilization, pricing and the costs of adding capacity. Higher revenue alone is not sufficient justification for growth.
5. Report earnings quality transparently. Present GAAP results, adjusted results, cash generation, liquidity and unit economics together. Explain material adjustments and distinguish management forecasts from realized outcomes.
These decisions form a broader executive discipline: manage price, volume, cost and cash as one connected system. The approach is useful wherever companies must protect margins while customers, competitors and input prices change.
The Executive Outlook: Can Frontier Turn Pricing Gains Into Durable Profitability?
Frontier has demonstrated that its commercial strategy can produce substantial revenue growth despite a more expensive fuel environment. Its next challenge is converting that performance into consistent profitability.
The strongest evidence of progress will not be another record revenue headline. It will be sustained RASM improvement, disciplined nonfuel costs, resilient demand and a narrower gap between reported and adjusted earnings where underlying conditions permit.
Investors should also examine subsequent cash-flow performance and liquidity, rather than treating one quarter’s adjusted profit as proof of a completed turnaround.
For CFOs and operating leaders beyond aviation, Frontier’s results reinforce a central principle of financial management: pricing power creates value only when the additional revenue produces sufficient economic contribution after costs.
The decisive question is not whether Frontier can charge more. It is whether the airline can continue generating attractive unit economics when fuel prices rise, capacity expands and customer demand responds to higher fares.
Frequently Asked Questions
Why did Frontier Airlines’ average fare revenue rise 71% in Q3 2026?
Frontier reported average fare revenue per passenger of $67.82, up from $39.74 a year earlier. The company attributed its record revenue to strong demand and continued development of its revenue-management initiatives; the increase does not mean every ticket price rose 71%. ir.flyfrontier.com
How much revenue did Frontier Airlines report in Q3 2026?
Frontier reported $1.355 billion in third-quarter 2026 revenue, up 53% year over year. RASM increased 30% to 11.87 cents. ir.flyfrontier.com
Why did Frontier report a GAAP loss despite higher fares?
Frontier reported a $104 million GAAP net loss while fuel expense and other operating costs increased. The company also reported $40 million in adjusted net income, so understanding its results requires examining both reported expenses and the adjustments used to calculate adjusted earnings. ir.flyfrontier.com
How should executives measure airline pricing power?
Executives should assess fare revenue per passenger, ancillary revenue, passenger volume, load factor, RASM, CASM and incremental contribution margin together. Pricing power is more sustainable when higher realized revenue improves unit economics without causing a disproportionate decline in demand or increase in costs.
What does Frontier’s Q4 2026 guidance indicate?
Frontier forecast adjusted diluted earnings per share between a $0.15 loss and a $0.05 profit, using a fourth-quarter average fuel-cost assumption of $4.75 per gallon. Actual results will depend on realized costs, revenue performance and operating execution. ir.flyfrontier.com