
Fidelity IRA Balances Hit a Record in 2026: What the 36% Contribution Surge Means for Employers

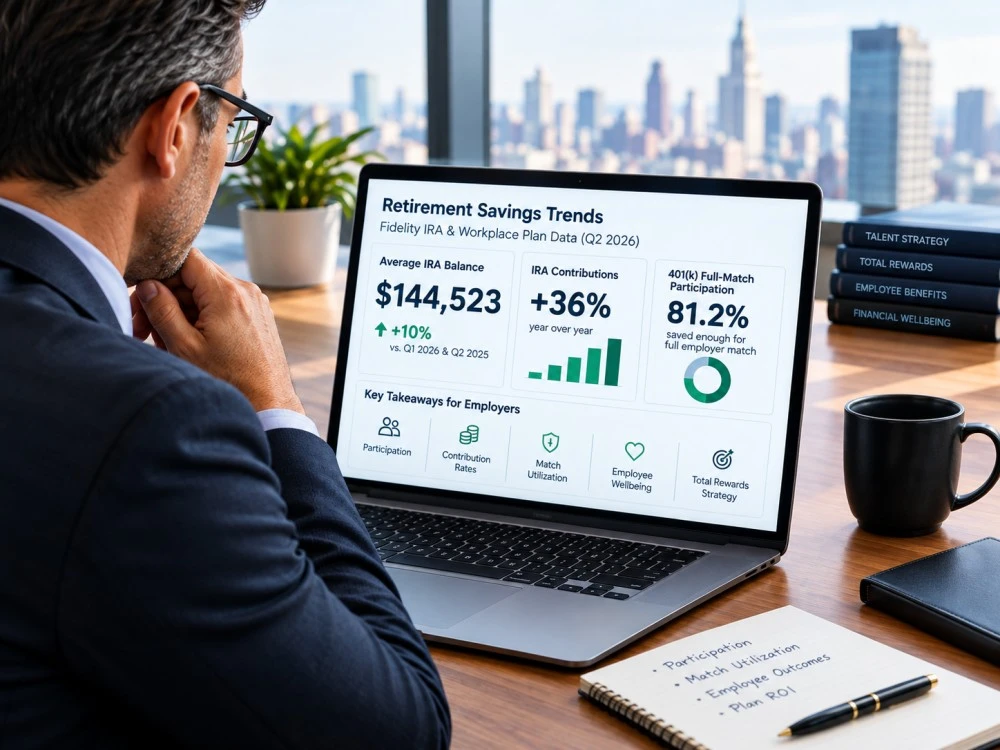
Fidelity’s Q2 2026 data shows average IRA balances reached $144,523 while IRA contributions rose 36% year over year, but the figures represent Fidelity’s accounts rather than the entire U.S. IRA market. Fidelity analyzed 20.3 million active IRA accounts with balances as of June 30, 2026; the average balance was up 10% from both Q1 2026 and Q2 2025.
The contribution figure is particularly relevant to employers evaluating employee demand for retirement saving. Fidelity reported that IRA savers increased contributions 36% from Q2 2025, providing a measurable signal of stronger saving activity within its customer base without establishing a comparable trend across every U.S. worker.
An IRA balance reflects both new contributions and investment performance, so a rising average balance does not measure employee saving behavior by itself. Fidelity said average retirement-account balances reached record highs in Q2 following a strong market rebound, making the contribution data a more direct indicator of saving activity than the balance increase alone.
Fidelity’s Sharon Brovelli, president of Workplace Investing, said the combination of strong savings behavior and plan design showed workers continuing to prioritize retirement and employer matching. That observation supports a business question broader than the IRA headline: how effectively are employers converting retirement benefits into employee participation and measurable workforce value?
Why Employers Should Care About an Account They Don’t Control
The business relevance of rising IRA contributions lies in what the behavior reveals about retirement-saving priorities, not in the IRA balance itself. Employees control their individual IRAs, while employer-sponsored plans can combine employee contributions with employer matching, payroll deductions, plan administration, eligibility requirements, and investment choices.
An individual IRA and an employer-sponsored 401(k) serve different functions. A company cannot assume that a rise in personal IRA contributions automatically means employees want a richer employer match, but the trend can inform a broader review of retirement benefits and total compensation.
Fidelity’s workplace data offers a useful comparison. The average 401(k) savings rate was 14.4% in Q2 2026, consisting of a 9.6% average employee contribution and a 4.8% average employer contribution. Fidelity also reported that 81.2% of 401(k) participants saved enough to receive their full employer match.
The executive question is straightforward: is the company getting sufficient employee engagement from the money it already spends?
A retirement plan with a generous employer contribution but weak participation can produce less employee value than a well-structured plan that employees understand and consistently use. The relevant issue is not simply how much the company contributes; it is how effectively the plan connects employer spending with employee behavior.
Small Businesses Are Becoming the Retirement-Benefits Battleground
Small-business retirement access is expanding, making plan design increasingly relevant to founders and executives competing for talent. Fidelity reported a 178% increase over five years in its retail small-business retirement accounts, a 46% increase in contributions to those accounts, and more than 25,000 participants saving through Fidelity Advantage 401(k), its pooled employer plan.
Those figures describe Fidelity’s small-business business rather than the entire U.S. market. They nevertheless show that retirement-plan adoption and participation have become a significant area of focus for smaller employers.
The U.S. Department of Labor identifies several retirement structures available to small businesses, including 401(k) plans, SIMPLE IRAs, SEP plans, and payroll-deduction IRAs. The appropriate choice depends on employer obligations, desired features, workforce characteristics, and administrative requirements.
The Cost-versus-Competitiveness Equation
A retirement plan creates strategic value when its employee value is proportionate to its total employer cost. CFOs should evaluate employer contributions alongside administration, payroll integration, participation, and the plan’s place within the company’s overall compensation budget.
A 50-person technology company may face a different benefits calculation from a 500-person manufacturer. A higher employer contribution may be relevant to one company’s hiring market while having less influence in another.
The Department of Labor notes that SIMPLE IRA plans are available to qualifying businesses with no more than 100 employees who earned at least $5,000 in the preceding calendar year and that do not currently maintain another retirement plan. SIMPLE IRA plans require employer contributions under specified matching or nonelective structures.
When a Retirement Benefit Becomes a Recruiting Asset
Retirement benefits become a recruiting asset when employees understand their value and the benefit compares favorably with competing compensation packages. The existence of a retirement plan alone does not establish that it changes candidate behavior.
That distinction matters for startups. A founder considering a richer employer match should compare the incremental retirement cost with other uses of compensation capital, including salary, equity, bonuses, healthcare, flexibility, and professional development.
The Department of Labor itself identifies potential recruitment and retention benefits among the reasons small businesses may establish retirement plans, but that is not evidence that a particular contribution level will produce a measurable retention result at an individual company.
Design the Benefit Around Employee Behavior, Not the Headline
Effective retirement-plan design starts with observed employee behavior rather than a headline statistic about aggregate IRA balances. Employers should examine participation, contribution rates, match utilization, workforce demographics, and the points at which employees stop contributing.
Fidelity reported that 81.2% of 401(k) participants saved enough to receive their full employer match in Q2 2026. That leaves a meaningful management question for individual employers: why are some employees not capturing the full available benefit?
A leadership team can address that question through a focused review:
- Participation: Who enrolls and who does not?
- Contribution behavior: At what rate do employees actually save?
- Match utilization: How much of the available employer contribution is being captured?
- Communication: Do employees understand the plan’s financial value?
- Payroll integration: Is saving easy enough to happen automatically?
- Workforce segmentation: Do participation and contribution rates vary materially by tenure, compensation, or other workforce characteristics?
The objective is not to maximize one statistic. It is to reduce unnecessary friction between an employee’s retirement-saving goals and the behavior the company’s plan is designed to encourage.
The Contrarian Case: Bigger Retirement Balances Do Not Prove Better Benefits ROI
Rising retirement balances are not evidence that an employer’s retirement benefits are producing a positive return on investment. Average balances can change because of market performance, employee tenure, age distribution, compensation, contribution rates, withdrawals, and account composition.
The distinction matters for executives because Fidelity’s $144,523 average IRA balance reflects both savings activity and investment performance. Fidelity reported that retirement-account balances reached record highs in Q2 after a strong market rebound, so balance growth cannot be treated as a pure measure of employee contributions.
An employer that raises its match from 3% to 5% may increase participation or employee satisfaction. It may also increase costs without producing a measurable change in recruiting or retention.
A modest plan improvement can also increase utilization without requiring a substantial increase in employer spending. Automatic enrollment, clearer communication, payroll integration, and simpler employee decision-making can affect plan usage independently of the size of the employer contribution.
The correct executive test is causal rather than cosmetic: what changed after the benefit changed?
A CFO can establish a baseline for participation, contribution rates, match utilization, and employer cost before changing the plan. HR can then track workforce outcomes over time, while recruiting teams can record whether retirement benefits appear in candidate feedback or offer decisions.
The Employer Metrics That Matter More Than Average Account Balance
CFOs should measure retirement benefits through employee engagement, employer cost, and workforce outcomes rather than average account balance alone.
A practical executive dashboard should include seven measures:
- Participation rate: Percentage of eligible employees actively contributing.
- Contribution rate: Average and median employee contribution levels.
- Match utilization: Percentage of eligible employees receiving the full available match.
- Employer cost per participant: Employer contributions and administration costs divided by active participants.
- Benefits satisfaction: Employee understanding and perceived value of the retirement benefit.
- Recruiting impact: Candidate feedback and offer acceptance where retirement benefits are identified as a factor.
- Retention correlation: Voluntary turnover among relevant employee groups before and after plan changes.
Recruiting impact and retention correlation require particular analytical discipline because correlation does not establish that a retirement-plan change caused a workforce outcome.
A stronger measurement approach establishes a baseline, changes a defined plan variable, and tracks workforce outcomes over time. That gives leadership teams a more defensible basis for determining whether retirement benefits are functioning as a meaningful component of total rewards.
The 2026 Retirement-Benefits Playbook for CEOs and CFOs
Leadership teams should audit retirement-plan effectiveness before committing additional compensation dollars.
Audit Participation and Match Utilization
Employers should first determine whether employees are using the retirement benefit already available. Weak participation or incomplete match utilization can indicate that plan communication, eligibility, contribution mechanics, or affordability deserves attention before the company increases its employer contribution.
Benchmark Total Employer Cost
CFOs should calculate the complete cost of the retirement program on both a per-employee and per-participant basis. Employer contributions should be considered alongside administration, payroll integration, compliance, and other plan-related expenses.
Segment the Workforce
Retirement-plan performance should be analyzed across relevant workforce segments rather than through a single company-wide participation rate. Tenure, compensation, age, employment type, and other appropriate characteristics can reveal where participation or contribution behavior differs materially.
Test Whether Plan Improvements Correlate With Workforce Outcomes
Retirement-plan changes should have measurable hypotheses attached to them. If leadership increases the employer match, it should define in advance whether success means higher participation, greater match utilization, improved benefits satisfaction, stronger offer acceptance, lower voluntary turnover, or another measurable outcome.
For smaller businesses, plan selection also requires attention to regulatory and administrative requirements. The Department of Labor states that SIMPLE IRA plans require employer contributions through either specified matching or nonelective arrangements, while SEP plans generally involve employer contributions to employees’ SEP-IRAs.
Executive Outlook: Retirement Benefits Move From Perk to Workforce Infrastructure
Retirement benefits are becoming a more consequential component of workforce infrastructure as small-business access expands and employees continue prioritizing long-term savings. Fidelity’s Q2 data shows a 36% year-over-year increase in IRA contributions alongside 178% five-year growth in its retail small-business retirement accounts.
The strategic conclusion is narrower than the headline.
The $144,523 average Fidelity IRA balance is not a universal employee benchmark, and the 36% increase in Fidelity IRA contributions is not a mandate for employers to increase matching contributions. Both statistics are signals that can inform a broader compensation and workforce discussion.
For CFOs, the priority is understanding cost and utilization. For CHROs and Total Rewards leaders, the priority is connecting retirement benefits to employee needs and the wider compensation proposition. For founders, the decision is whether retirement benefits deserve greater emphasis within the company’s talent strategy and operating budget.
The strongest decision framework is measurable: establish participation, cost, utilization, and workforce-outcome baselines before expanding employer contributions.
That approach gives leadership teams a defensible basis for deciding whether retirement spending is functioning as a standard benefit or producing measurable business value.